We earn commission when you buy through affiliate links.
This does not influence our reviews or recommendations.Learn more.
React is one of the most used JavaScript UI libraries in modern web development.

This library was released by Facebook in 2013 and has since been adopted by small and big names worldwide.
This library is loved for its component-based architecture, meaning the codebase is split into small, reusable components.
React has various libraries that are designed for different purposes.
React table libraries are a collection of pre-written code blocks or components developers can use to generate react tables.
React tables makes it easy to present large datasets and make them more accessible to users.
This library is written in React and has an API supporting theming, accessibility, and real-time updates.
This library is built exclusively for React.
Material-table
Material-tableis a Material-UI-based React table component.
This library is free and open-source.
you’re free to install it through a package manager like NPM or Yarn.
This library needs @emotion/react and react-dom libraries for it to work.
Material React Table
Material React Tableis a library built using Material UIV5and TanStack TableV8.
This library works best in projects already using MUI components, but not a must.
AG Grid
AG Gridis a React library suitable for professional developers building enterprise applications.
This library is suitable for plain JavaScript applications andJavaScript librariesand frameworks.
Tabulator
Tabulatorare interactive table and data grids for React and JavaScript.
Rc-table
Rc-tableis a React table component packed with useful functions.
This library comes as an NPM package and has 5 dependencies.
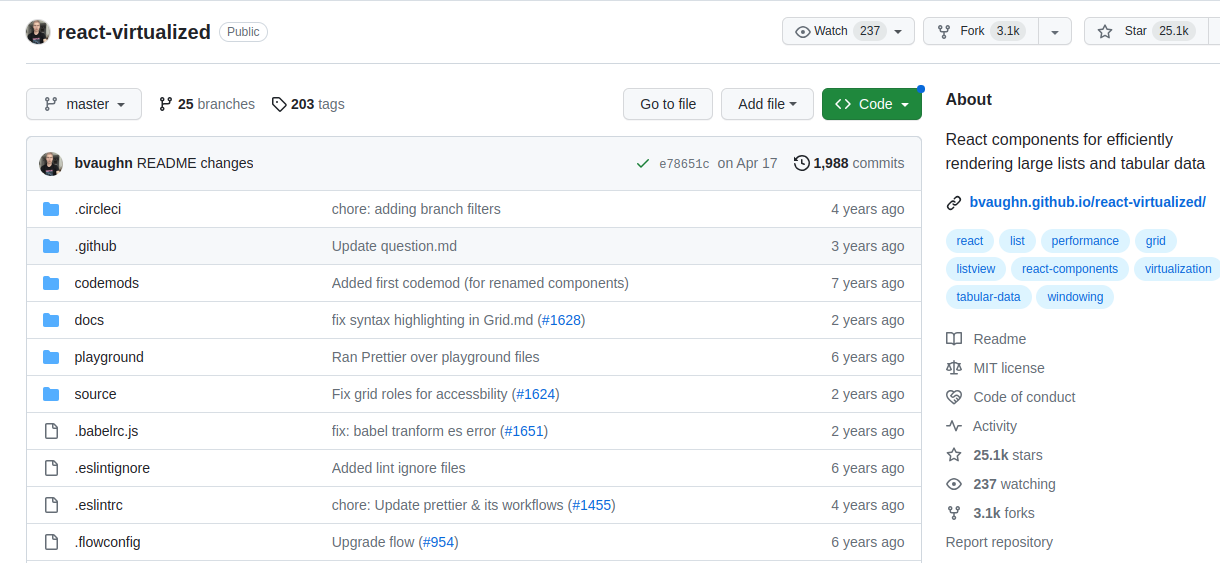
React-virtualized
React-virtualizedis a collection of React components that allows developers to display large lists and tabular data.
This library comes as a React package that you’re able to install using NPM.
Most of its dependencies are managed by NPM automatically.
You may combine these libraries with React charting libraries to make your data more insightful.
