We earn commission when you buy through affiliate links.
This does not influence our reviews or recommendations.Learn more.
Time series data is a sequence of observations collected at regular intervals.
This structured format enables data scientist and data visualization tools to analyze patterns and relationships that unfold over time.
It introduces an order dependence between a set of observations.
Time series are ubiquitous in todays data-driven world.

As every event follows the arrow of time, we are in constant interaction with various time-series data.
However, the data within that time series need not be generated at regular intervals.
Such instances encompass irregular time series where data follows a temporally phased sequence.

This implies measurements might not occur at regular intervals.
However, data might be generated at discrete time intervals or as a burst.
ATM withdrawals or account deposits are examples of irregular time series.

Technically, in a time series, one or more variables change over a given time period.
If a single variable varies over time, it is termed as Univariate time series.
For example, consider a sensor measuring the temperature of a room every second.

Here, only a one-dimensional temperature value is generated at every instant (i.e., second).
For example, consider bank economics.
Some of its main use-cases include monitoring, forecasting, and anomaly detection.
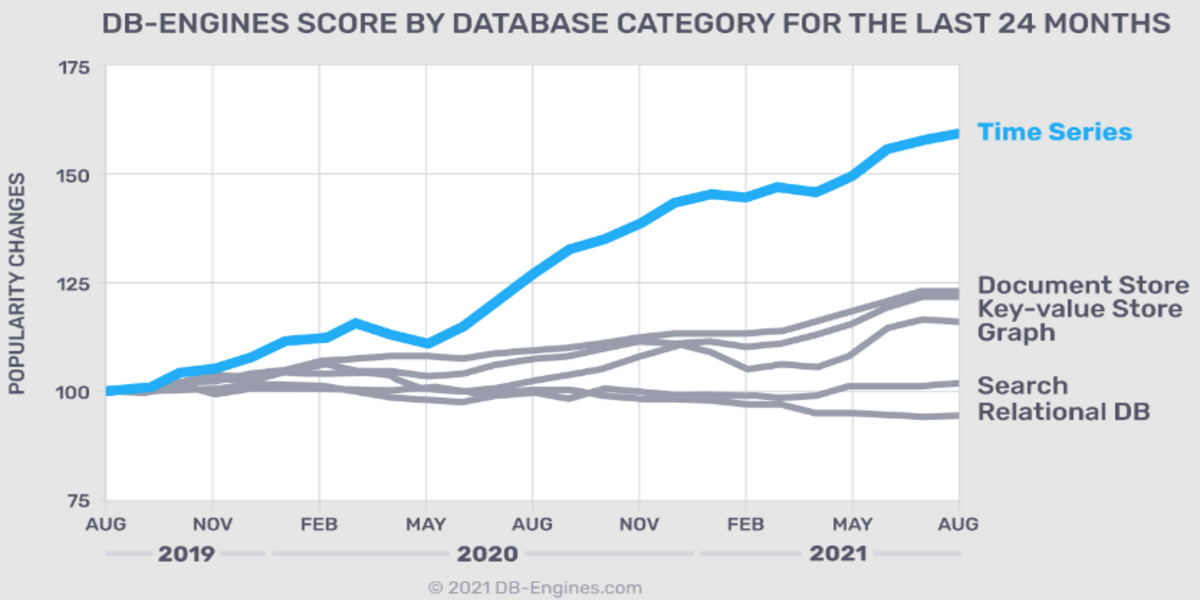
For example, time-series forecasting plays a critical role in determining the popularity of database management systems.
The tendencies can either rise, fall, or remain stable over different sections of time.
The overall trend, however, must always equate to an upward, downward, or stable pattern.
Hence, such trends are also called curvilinear correlations.
They have irregular short bursts and affect the variables under study.
They tend to have a similar or almost the same pattern during a 12-month period.
Seasonal variations are either man-made or naturally occurring.
Different seasons or climatic conditions play a critical role in such variations.
For example, crop production relies entirely on seasons.
Man-made conventions include festivals, parties, and occasions like marriages.
Such short-term events recur year after year.
For a business, one complete period is regarded as the Business Cycle.
These cyclic business variations may be regular but not periodic.
Generally, businesses undergo a four-phased cyclical process comprising prosperity, recession, depression, and revival.
Random or Irregular Movements
Random components cause a significant variation in the variable under observation.
These are purely irregular fluctuations without any set pattern.
#1.
Deterministic Time Series
A deterministic time series can be described with an analytic expression.
It does not involve random or probabilistic aspects.
Mathematically, it can be expressed exactly for all time intervals in terms of a Taylor series expansion.
This is possible if all its derivatives are known at some arbitrary point.
These derivatives explicitly specify the past and future at that time.
#2.
Non-deterministic Time Series
A non-deterministic time series has a random aspect associated with it which prevents its explicit description.
Hence, analytic expressions arent feasible enough solutions to express such a time series.
This includes means and measures of dispersion, i.e., variances.
#3.
Hence, various statistical forecasting methods are based on the argument that the time series is just about stationary.
This implies that the times series can be regarded as stationary in approximation by applying simple mathematical transformations.
#4.
Non-stationary Time Series
In a non-stationary series, the statistical properties vary with time.
Non-stationary time series describes unpredictable data, preventing it from being modeled or forecasted.
Here, data analysts record data in constant intervals over a fixed time period.
The data observation rate, i.e., the time interval, can vary from seconds to years.
The parameters necessary for analysis may vary across different domains and disciplines.
A good sample size is a subtle representation of the authenticity of a discovered trend or pattern.
Additionally, time series analysis is also suited for predicting future events based on past recorded data.
Companies generally employdata visualization softwareto determine such anomalies in data.
Here are some examples from different industry sectors to better understand the nuances of times series analysis and forecasting.
This may involve predicting vulnerability at stock prices, determining net capital requirements, or forecasting exchange rates.
With the migration oftime series databasesto clouds, organizations can gain access to unlimited resources on-demand.
Time series databases in the cloud infrastructure are suitable for compute-intensive workloads.
This includes performing risk calculations in response to real-time market trends.
Hence, cloud infrastructure amplifies and scales the benefits of time series data.
#1.
Time series data is used to explain, correlate and predict the dynamic financial market.
Time series analysis plays a key role in financial analysis.
It is used in interest rate prediction, forecasting the volatility in stock markets, and many more.
This analysis is effectively used in the investment sector to monitor the security rates and their fluctuations over time.
#2.
Time Series Data in the Medical Industry
Healthcare is rapidly emerging as a data-driven field.
In addition to financial and business analysis, the medical domain is greatly leveraging time series analysis.
In the healthcare sector, deriving inferences from the constantly changing time-series data is of critical value.
Additionally, advanced medical practices demand that patient records be connected over time for better visibility of patients health.
With advanced medical instruments coming to the fore, time series analysis has established itself in the healthcare domain.
This leads to a consistent data collection of time-dependent medical data for both sick and healthy individuals.
#3.
Time series data has long been associated with the field of astronomy.
In 800 B.C., sunspot time series data were collected at regular intervals.
Astronomers constantly monitor such live-streaming data to detect cosmic events in real-time as and when they occur.
#4.
As days progressed, scientists started recording weather-related data on instruments such as barometer to compute atmospheric variables.
The data were collected in regular intervals and kept in different locations.
With time, eventually, weather forecasts began featuring in newspapers.
Such stations have advanced functional devices that are interconnected to gather and correlate weather data from various locations.
The correlated data is used to forecast weather conditions at every time instance depending on requirements.
#5.
Time Series Data in Business Development
Time series data enables businesses to make business decisions.
This is achieved as the process analyzes past data to derive future events and throw light on probable possibilities.
