We earn commission when you buy through affiliate links.
This does not influence our reviews or recommendations.Learn more.
Server monitoring tools are essential for companies to ensure optimal performance, minimize downtime, and enhance security.
Businesses can use built-in commands to monitor the metrics.
However, it is always better to opt for server monitoring tools for more streamlined and efficient infrastructure monitoring.
you might trust Geekflare
At Geekflare, trust and transparency are paramount.
Nagios
Best for Small to Medium Infrastructure Size
Nagios is an enterprise-ready open-source monitoring tool.
Nagios offers 4 different types of monitoring solutions.
All these products rely on Nagios Core the monitoring and alerting engine.
It integrates well with other apps, including LogicMonitor, Veeman ONE, New Relic and more.
It supports a wide range of Linux distributions, making it versatile for various environments.
Support multi-user access with detailed role-based permissions.
Cons
Expensive pricing options.
Lack of intuitive and modern UI design.
Pricing starts at $2,495 for monitoring 100 nodes.
OpManager supports VoIP, server, VMware, and Hyper-V monitoring, providing comprehensive performance insights across your infrastructure.
Additionally, it provides integrated troubleshooting capabilities.
Include a user-friendly interface with customizable dashboards.
Experience occasional delays in alert notifications under heavy loads.
Complex setup and usage, not ideal for beginners.
ManageEngine OpManager Pricing
OpManager is a paid tool with pricing starting at $245 for 25 devices.
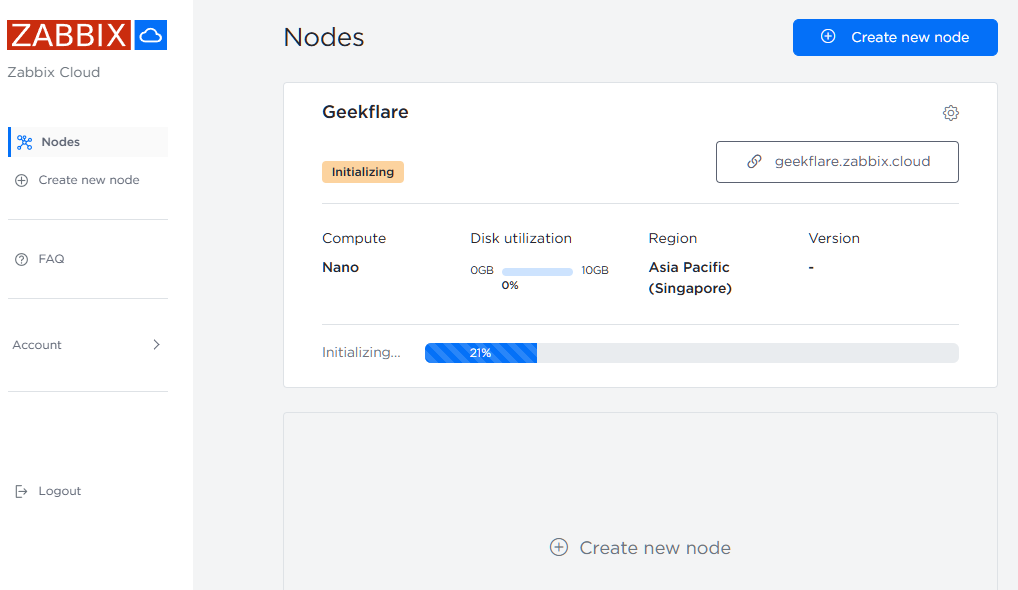
Zabbix is an open-source platform that supports both cloud and on-premises deployments.
Zabbix Cloud spans five regionsN.
Virginia, Frankfurt, Ireland, Singapore, and Sao Pauloand offers seven-tier options.
Over 250 global partners and vendors provide additional support.
Support a wide range of OS platforms, including Linux and Unix.
Enable agentless monitoring, simplifying deployment and management.
Requires a steep learning curve.
Consume substantial system resources, especially in large environments.
Zabbix Pricing
Zabbix Cloud offers a free tier that lets you try out their service.
It offers seven-tier options, with pricing starting at $50/month.
SoundCloud created Prometheus in 2012.
It is an open-source tool that excels at systems monitoring and altering.
With powerful built-in alerting capabilities, it can send notifications based on pre-defined thresholds.
Together, they offer a robust solution for observability and monitoring.
Prometheus + Grafana Features
Simplify customizable notifications with Prometheus Alertmanager.
Enable real-time monitoring with efficient time-series database and querying.
Integrate well with cloud-native and containerized environments like Kubernetes.
Requires a steep learning curve, especially for complex queries and configurations.
Complex manual configuration for scaling in high-availability setups.
Its paid plan starts at $19 per month.
As for Prometheus, it is free to use.
However, when a cloud provider provides the managed service, they charge for it.
Collectd helps find performance bottlenecks through performance analysis or simply monitor systems.
It supports integration with Graphite, Hosted Graphite, Librato, HostedMetrics and Circonus.
Collectd Features
Support100+ plugins, allowing for extensive customization and flexibility.
Offers a plugin-based architecture, allowing users to extend functionality easily based on needs.
Integrate easily with time-series databases and visualization tools.
Daemon need to restart every time the new plugin is introduced
Lacks a built-in visualization dashboard and built-in alerting.
Collectd Pricing
Collectd is open source and hence free to use.
Its core capabilities include tracking infrastructure health and performance and insightful data visualization.
Icinga can manage thousands of services and servers with automated monitoring, minimizing manual workload.
Icinga integrates well with DevOps tools, including AWS, Puppet, Chef, Vagrant, and others.
Icinga Features
Deliversflexible notifications, including alerts via email, SMS, Slack, or third-party integrations.
Offer scalability, making it suitable for both small setups and large enterprise environments.
Provides a detailed and customizable dashboard.
High learning curve with the complex configuration process.
Limited customizability, especially at the front interface.
Icinga Pricing
Businesses need to contact sales to get custom pricing.
Munin
Best to Analyze Resource Trends
Munin is a web-based plug-and-play monitoring tool that analyzes resource trends.
It also helps analyze issues and resolve them to ensure optimal performance.
It also updates graphs if needed.
Munin Features
Enable easy historical data visualization for trend analysis.
Highly scalable with support for up to 100+ nodes cluster.
Allow lightweight installation with minimal configuration needs.
Support extensive plugins for monitoring various system metrics.
Not frequently updated or maintained.
Require manual setup for complex monitoring tasks.
Munin Pricing
Munin is open-source and, hence, free to use.
It enables organizations to get real-time data visualization with the option to set reliable alerts for data metric anomalies.
It supports various operating systems and services, including Linux, docker containers, IoT devices and macOS.
Netdata is easy to install and configure.
Netdata Features
Offers AI-powered anomaly detection.
It supports multi-node monitoring, making it ideal for managing distributed infrastructures.
Allow integration with popular platforms like Grafana, Prometheus, and Elasticsearch.
Windows environment monitoring needs improvement.
Only accessible through the web online window.
Netdata Pricing
NetData offers two pricing plans:HomeandFor Work.
The Home plan includes a free community on-premises solution with an open-source Agent (OSS).
For advanced users, theHomeLabplan costs $90 and provides unlimited metrics, dashboards, and nodes.
TheFor Workplans, designed for professionals, start at $4.50 per node per month.
Monit
Offers Basic Server Monitoring
Monit is an open-source utility designed for server monitoring and error recovery.
It provides automated maintenance and repairs in response to performance issues or errors.
For instance, if Sendmail stops running, Monit will attempt to restart it automatically.
Monit will also look into resource management, such as checking if Apache uses too many resources.
If it does, itll restart it and send an alert notification.
Monit is widely available in most Unix distributions, such as FreeBSD, OpenBSD, and other Linux distributions.
Monit Features
Offer automatic recovery options for failed services, reducing downtime.
Comes with direct command line access
Provide support for various platforms, including Linux, FreeBSD, and OpenBSD.
Requires configuration expertise for optimal performance.
Limits scalability for larger enterprise environments
10.
Sensu succeeds in automating monitoring for dynamic infrastructure.
It also supports multi-cloud setup, offering real-time visibility for auto-scaling projects.
It comes with native auto-remediation and provides self-heading via Sensu, Ansible, and other third-party APIs.
Sensu Features
Offers pre-configured templates for monitoring-as-code workflows.
Provides automated workflows for incident management.
Allows real-time monitoring and alerting, ensuring timely issue detection.
Northbound interface APIs are not secure.
Complex initial setup and configuration.
Sensu Pricing
Sensu offers free and paid plans.
The free version supports up to 100 nodes and one site.
Datadog
All-in-one Observability Platform for Enterprise
Datadog is an all-in-one observability real-time platform.
It helps enterprises collect, monitor and correlate server metrics on the cloud or physical servers.
Datadog provides real-time server status, ensuring that the software runs smoothly.
Datadog offers 800+ integrations, including Azure, Docker, AWS, MongoDB and others.
Datadog Features
Supports advanced alerting with AI-driven anomaly detection, reducing false alerts.
Offers a user-friendly interface and customizable dashboard.
Integratewell with cloud providers like AWS, GCP, and Azure.
May experience minor data delays with high-frequency metrics, impacting real-time insights.
Require a learning curve for beginners due to the extensive features.
Datadog Pricing
Datadog offers a free plan with 1-day metric retention and up to 5 hosts.
Its paid plan starts at $15 per host per month.
Sematext
Cloud-based Monitoring Solution
Sematext is a cloud-based monitoring solution which provides real-time Linux monitoring.
Sematext Features
Offers fine-tuned Linux metrics alerts.
Supports distro, Ubuntu, RedHat, CentOS and more.
Facilitatetroubleshooting with detailed logs and metrics.
Complex setup and configuration.
Limitdata retention and advanced features in the free trial.
It is a powerful monitoring software that lets you understand the real cause before it reaches the customers.
AI enhances monitoring and instantly alters if it finds any unpredictable anomaly or data.
New Relic Features
Excellent AI-powered alerting functionality.
Provides a centralized view of all processes and workflows.
Offerreal-time insights for faster troubleshooting.
Requiresa learning curve for new users due to its extensive features.
Occasionallyexperience delays in data reporting, especially during high traffic.
New Relic Pricing
New Relic follows pay-as-you-grow plans.
It is web-based and hence can be used from anywhere you want, especially for remote system monitoring.
Support integration with InfluxDB, Grafana, and Nagios.
Enable remote monitoring through web-based UI and terminal access.
Documentation can be improved.
Lack of advanced logging and historical data analysis capabilities.
Glances Pricing
Glances is open-source and free to use.
