We earn commission when you buy through affiliate links.
This does not influence our reviews or recommendations.Learn more.
Visualization is an important way to make sense of data and draw informative and actionable insights.

A good visual lets the reader get a basic sense of the information with just a glance.
A popular visualization used to view data is a heatmap.
What Is a Heatmap?
A heatmap is a 2-dimensional image representing data as a matrix or grid of points.
A shade of a color plot represents each data point.
Darker shades represent higher values than lighter shades.

Heatmaps make it easy to identify patterns, trends, and variations in data.
Where Are Heatmaps Used?
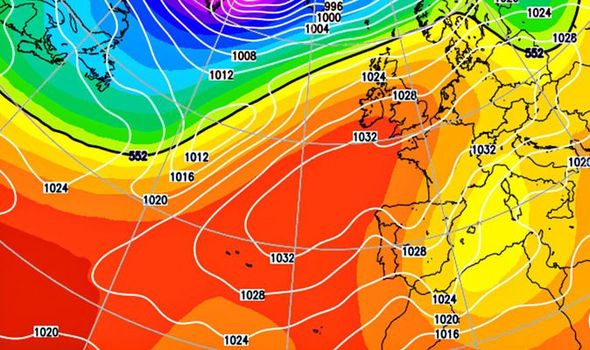
Heatmaps are helpful in showing how values vary over space.
This is an example weather forecast fromthe Daily Expressshowing the expected temperatures as a heatmap.
This makes it easier to visualize which places will be hot, cold, or in between.
This can then be used to optimize user interfaces and enhance user experience.
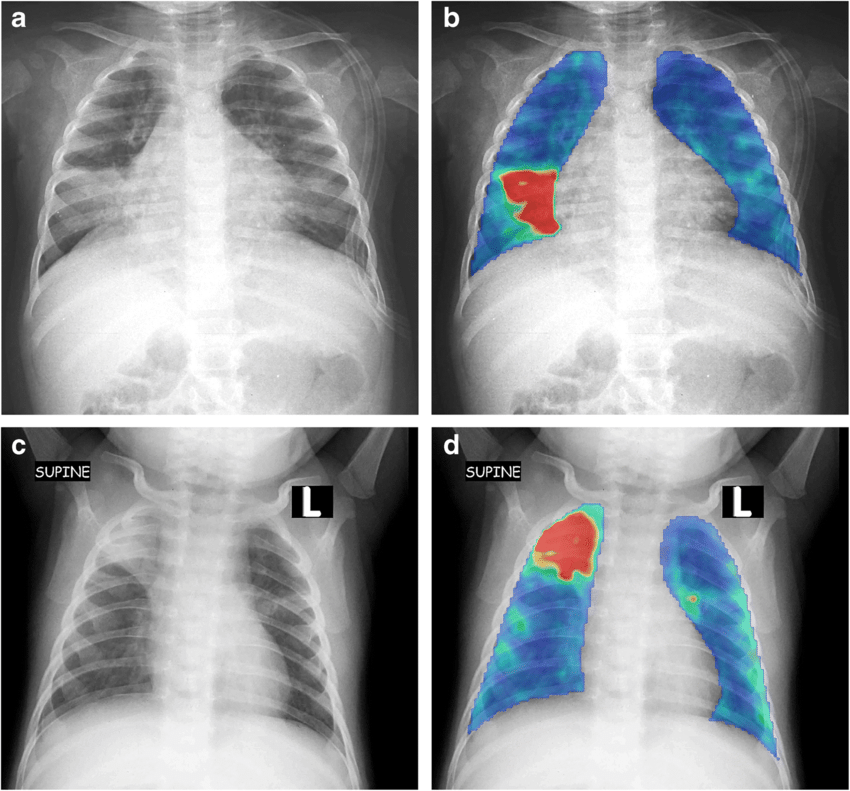
Medical Imaging
Heatmaps visualize areas of high or low activity in the body.
This can identify anomalies and diseases and assess the progression or response to treatment in conditions like cancer.
Libraries for Creating Heatmaps in Python
Python is a popular language for data analysis and visualization.
This is because of its simple syntax and extensive ecosystem.
There are multiple libraries that you might use to create heatmaps in Python.
How to Generate a Heatmap?

In this section, I will explore how to create heatmaps using Matplotlib, Seaborn, and Plotly.
To code, I am going to be usingGoogle Colab.
It is a free-to-use instance of a Python Notebook that uses Google Infrastructure to run your code.

It requires no setup, so you’re free to also use it to follow along.
To begin, we will cover Matplotlib first.
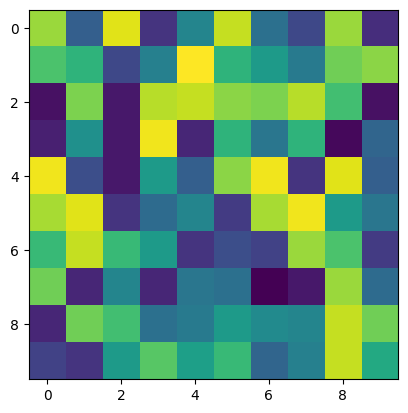
Matplotlib
To begin, we start by importing the Matplotlib library.

We will also need NumPy to generate a random dataset.
We pass in data as the argument.
We can do more by passing on additional arguments we will get into later.
If you trigger the cell, you should see a heatmap.
While this is great, there are many customization options available to you.
The full list ofcmapoptions is foundhere.
To do this, you would write text in each of the cells usingplt.text().
The last thing we will do with the heatmap is to set the tick labels on the axes.
We will use theplt.xticksfunction for the x-axis andplt.yticksfunction for the y-axis.
These methods are called the same way; the only difference is the axis each method affects.
The first argument is the list of places to insert ticks.
This is represented as an array of indices.
The following argument is the actual list of labels that would be inserted.
Heres an example of how we would insert ticks:
And thats it!
That is how you create a heatmap in Matplotlib.
The complete code solution is detailed below.
However, using Matplotlib is not the easiest solution.
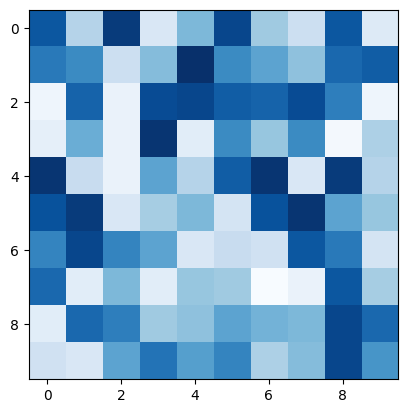
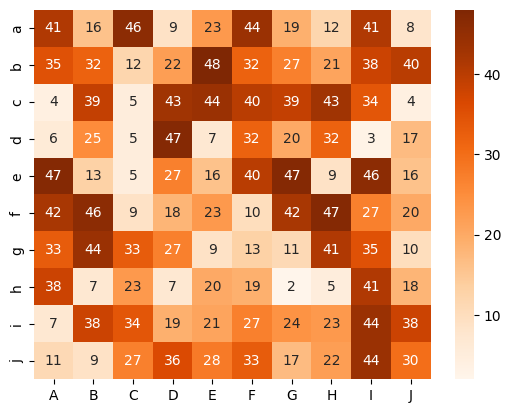
Seaborn
In this section, we will recreate the previous example using Seaborn.
Seaborn is a library that builds on top of Matplotlib.
It provides abstractions that make it easier to work with.
To create a heatmap, we start by importing the libraries we are going to use.
We imported Matplotlib because Seaborn requires it.
Next, we also need to import NumPy to generate a random dataset.
Lastly, we have to import Seaborn.
Next, we generate the dataset using NumPy.
After doing this, we create our lists of tick labels.
Then lastly, we create the actual heatmap by calling the heatmap function of the sn module.
As you’re able to see, we passed several arguments.
This function takes in the data to plot as a positional argument.
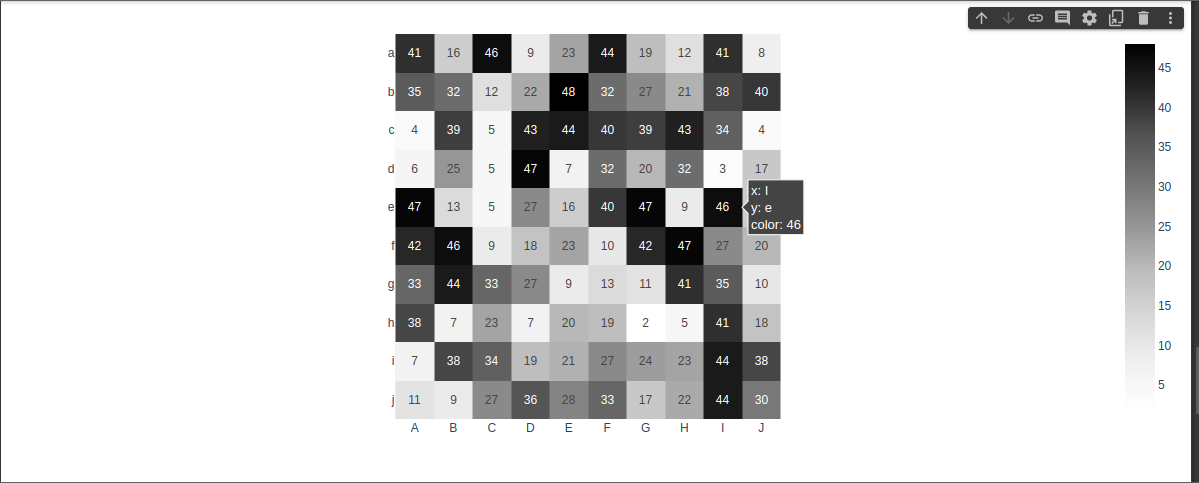
In addition, the graph generated is interactive compared to other libraries that produce static images.
We covered the main libraries Matplotlib, Seaborn, and Plotly.
We also saw how Seaborn and Plotly provide simplified abstractions over Matplotlib.
One critical use of Heatmaps is tracking how people use your websites.
Next, check outheatmap toolsthat tell you where your users are clicking.
