We earn commission when you buy through affiliate links.
This does not influence our reviews or recommendations.Learn more.
Lets learn the fundamentals of Grafana Loki, a multi-tenant log aggregation system.
In a production environment, downtime is unacceptable.
It can lead to a massive loss in business revenue and reputation.
It helps in saving costs and identifying issues that might occur in the future.
Nowadays, every size an organization is using DevOps principles and tools.
Containers and Kubernetes are the most popular ones.
And monitoring of such a system is done very efficiently withPrometheus.
But where Prometheus lags is the logging part.
It doesnt provide a centralized logging system, and this is where Loki comes into the picture.
What is Grafana Loki?
Grafana Lokiis a multi-tenant log aggregation system started by Grafana in 2018 and released under the Apache 2.0 license.
This system was developed by getting inspired by Prometheus.
It is majorly used with cloud providers and with tools like Prometheus and Grafana.
Loki is similar to ELK/EFK stack, but it is easier to set up and operate with better functionalities.
It makes the index smaller, which simplifies the operations and eventually lowers the cost.
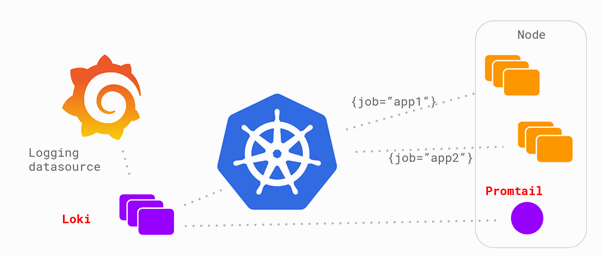
Promtail is an agent that has to be installed on each node running your applications or services.
The agent promtail tails the logs from the local file system and pushes the logs to Lokis central server.
After this, you’re able to query back your logs usingGrafana.
Loki Use Cases
Below are the popular use cases for using a logging system like Loki.
Installing Loki and Promtail
Lets quickly find out how to install and visualize logs on Grafana.
Download the Loki package according to the system you are using.
Do not download cli or canary Loki packages.
I am downloadingloki-linux-amd64.zipandpromtail-linux-amd64.zipfor my Ubuntu system.
After downloading finishes, extract the files of Loki and Promtail, and put them in a single directory.
Now, download the generic configuration file ofLokiandPromtail.
To start Loki, spin up the command below with the Loki configuration file.
This will start Loki and displays the Loki logs in the terminal.
To start Promtail, fire off the command below with Promtail configuration file.
Promtail is required to get the logs into Loki.
Visualize Log using Loki and Grafana
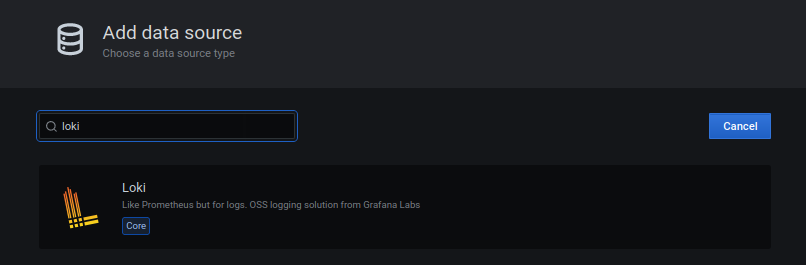
Grafana provides built-in support for Loki.
Loki is already present in the data sources of Grafana.
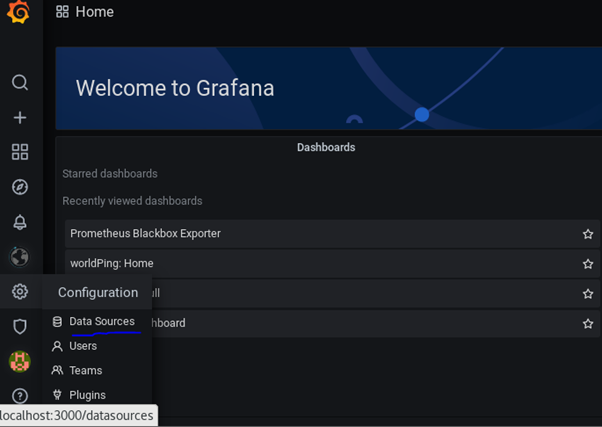
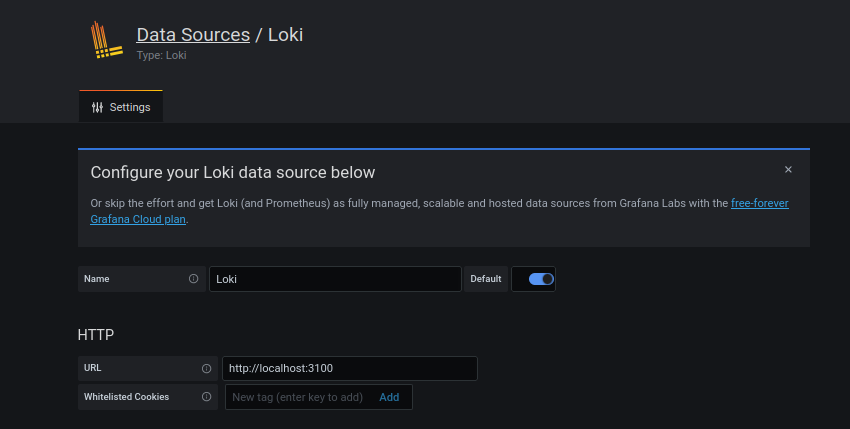
Step 1:Go to Grafana Configurations and hit Data Sources.
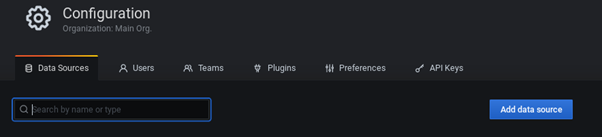
Step 2:In Data Sources, you could search the source by name or jot down.
Step 3:Search by the name Loki.
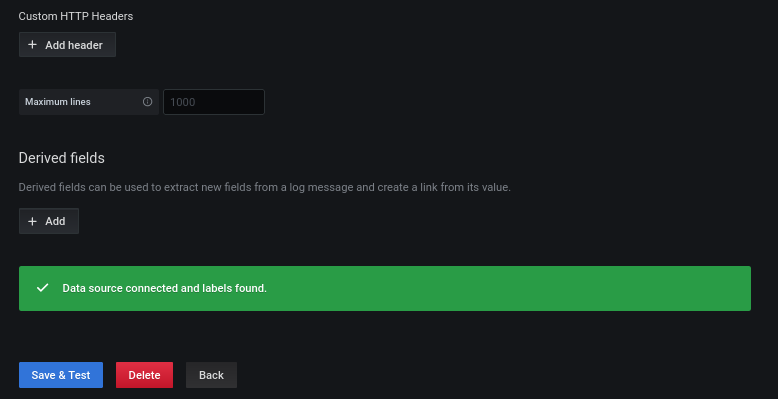
it’s possible for you to see this data source is already present in Grafana.
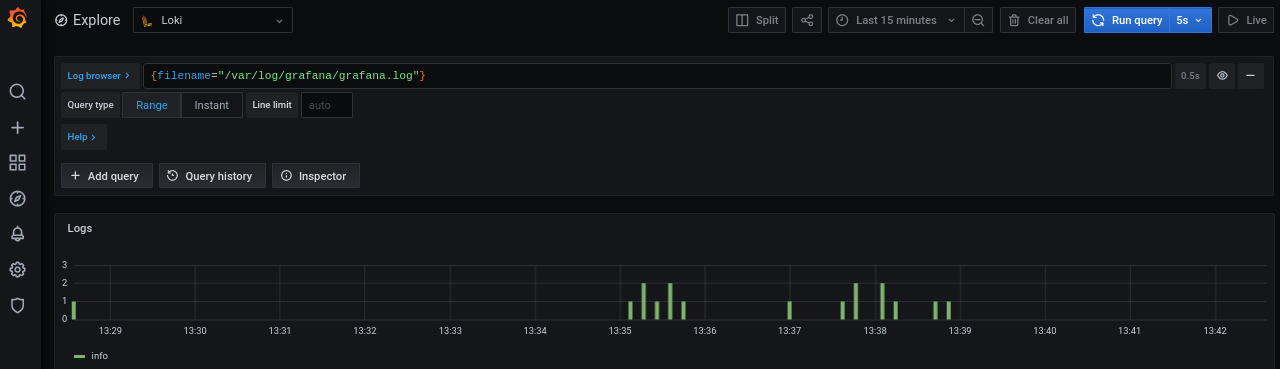
Step 5:snag the Explore tab on the left side.
Select Loki from the dropdown of data source selection.
Now, I would like to visualize the activity of Grafana logs.
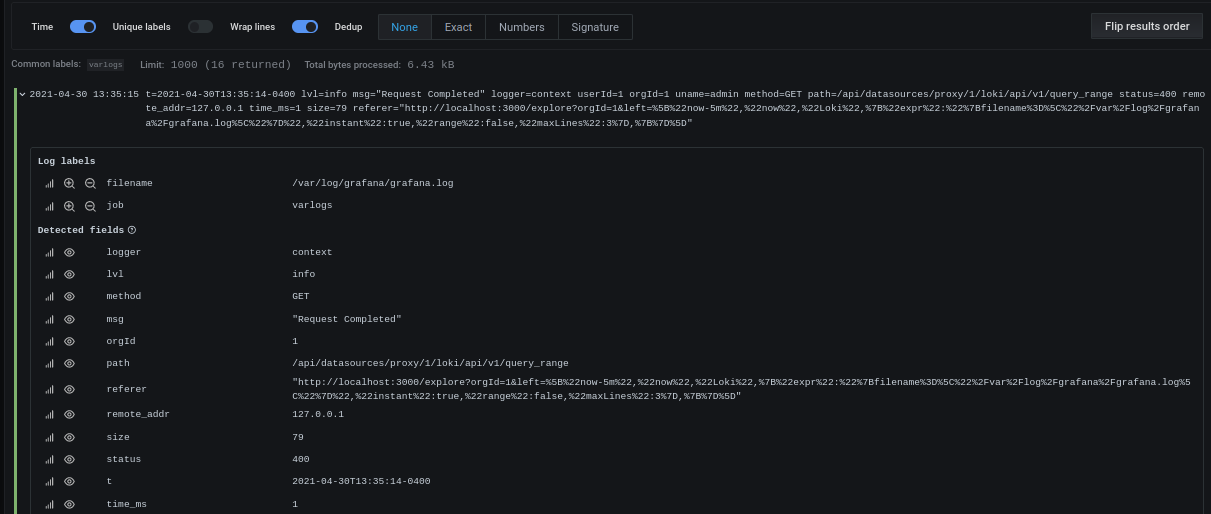
The green bars below are entries of events in the log file.
Looks beautiful, isnt it?
So, that was all about getting started.
I would strongly advise you to further check out the below webinar video explaining observability with Loki.
You would need a cost-effective way tocollect the logs, store them and then make use of them.
Loki is a perfect solution for such cases.
Next, get to knowGrafana Tempo.
