We earn commission when you buy through affiliate links.
This does not influence our reviews or recommendations.Learn more.
Love Grafana for server metrics monitoring?

Youll love Blackbox Exporter for website monitoring too!
Blackbox Exporterby Prometheus is used to probe endpoints like HTTPS, HTTP, TCP, DNS, and ICMP.
After you define the endpoint, the Blackbox exporter generates hundreds of metrics that can be visualized using Grafana.

Measuring response time is the most important feature of the Blackbox exporter.Blackbox Exporter is a self-hosted solution.
Prerequisites
Blackbox Exporter Installation
Let me show you how to install Blackbox exporter first.
I am downloading theblackbox_exporter-0.16.0.linux-amd64.tar.gzfile.

Check all the files inside Blackbox exporter.
Two filesblackbox_exporterandblackbox.ymlare important here.
Below command will give you all the flags you could use with Blackbox exporter.

Step 2: Create User for Blackbox
This is optional.
You may either create a new user to run Blackbox or use existing Prometheus users to run it.
Provide permissions and assign ownership of all its files to the new user.
Create a fileblackbox.serviceand put the lines mentioned below in the file and save it.
Dont forget to change the path to the actual where you have extracted it.
Blackbox exporter has successfully started.

Athttp://localhost:9115/you’re able to find Blackbox Exporter running.
Integrating Blackbox with Prometheus
Lets integrate Blackbox Exporter with Prometheus to start scraping the metrics.
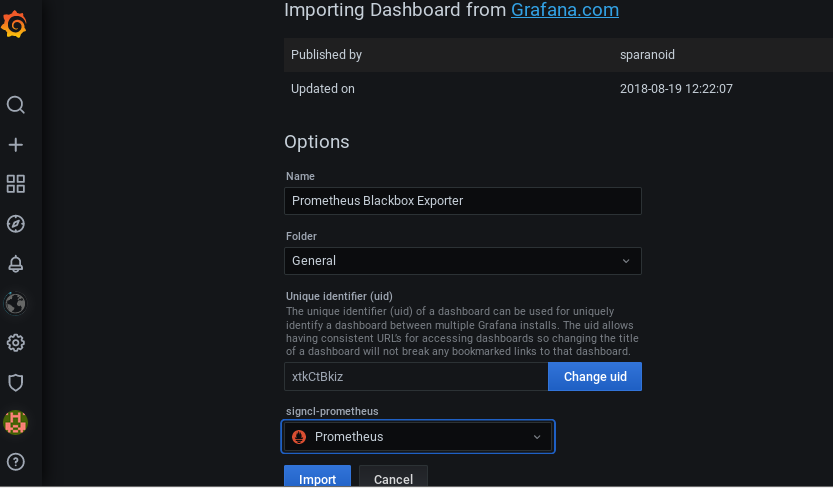
Now it is time to visualize the Blackbox job on Grafana.

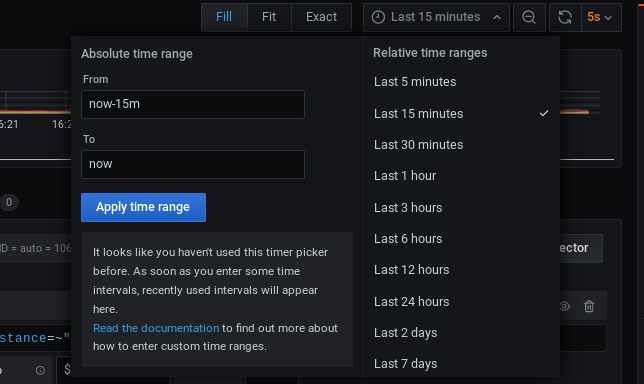
you could change the time range for which you want the visualization to appear.
There are plenty of options, and I would strongly suggest playing around with it to experience it.
If you are curious about learning Grafana, then check out hisonline course.